


【ADHD血液診断】ランダムフォレストによる予測モデル
目次
0. はじめに
本記事は、以下の記事の続きになります。
https://www.bioinforest.com/adhd1-4
1. データセットの用意
Text
import timeimport pickle
import pandas as pdimport numpy as np
import matplotlib.pyplot as pltimport seaborn as sns
from scipy.stats import pearsonrfrom sklearn.decomposition import PCAfrom sklearn.manifold import TSNEimport umapfrom scipy.sparse.csgraph import connected_components
import scipy.stats as stfrom scipy.stats import mannwhitneyu
from sklearn.model_selection import train_test_splitfrom sklearn.ensemble import RandomForestClassifier
from sklearn.metrics import accuracy_scorefrom sklearn.metrics import roc_curvefrom sklearn.metrics import roc_auc_score
from sklearn.model_selection import cross_val_scorefrom sklearn.model_selection import StratifiedKFoldfrom sklearn.model_selection import GridSearchCV
import warningswarnings.filterwarnings('ignore')
X = df_ttest.iloc[:, :-1]y = df_ttest.iloc[:,-1]
X_train, X_test, y_train, y_test = train_test_split(X, y, test_size=0.2, stratify=y)2. 学習
Text
model = RandomForestClassifier()model.fit(X_train, y_train)test = model.predict(X_test)3. 精度
Text
score = accuracy_score(y_test, test)scoreText
0.81254. ROCカーブ
Text
prob = model.predict_proba(X_test)
fpr_all, tpr_all, thresholds_all = roc_curve(y_test, prob[:,1], drop_intermediate=False)
plt.plot(fpr_all, tpr_all, marker='o')plt.xlabel('FPR: False positive rate')plt.ylabel('TPR: True positive rate')plt.grid()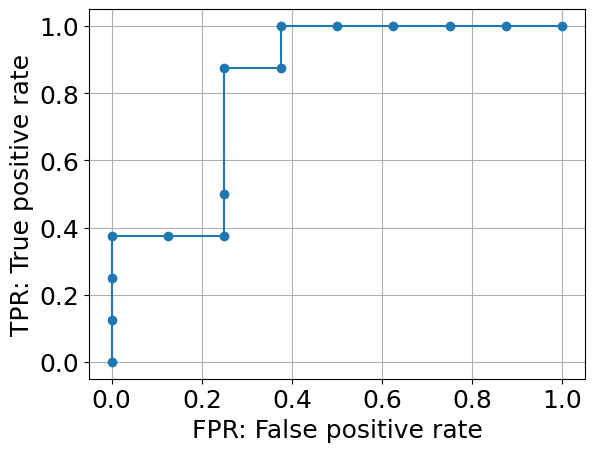
5. AUC
Text
roc_auc_score(y_test, prob[:,1])Text
0.8281256. まとめ
題材にもよりますが、AUCは0.7を超えれば十分に良いモデルと言われます。
今回のランダムフォレストによって作成したモデルで十分にADHDを判定できるモデルができたと言えます。
あとは、交差検証やハイパーパラメータ、訓練データ・テストデータを入れ替えた再現性確認をすれば良さそうです。